Table of Contents
Voronoi diagrams of oriented points with Vorosketch
Vorosketch can draw Voronoi diagrams of points in the plane that have an orientation or direction, applying one of various distance measures that take the orientation of the sites into account. In particular, the following distance measures are supported:
All of these distance measures are invariant under translation and rotation of the coordinate system. Therefore, Vorosketch implements each distance measure d, where d is one the above, as a distance measure “oriented(@d)”, where @d is a distance measure that defines the distance to any point in the plane from a “site” that is assumed to be in the origin, directed upwards. The “oriented” function takes care of translating and rotating the coordinate system for each site such that these assumptions hold. On the rest of this page, we will therefore assume that a site is always located in the origin, directed upwards.
Vorosketch also supports distance measures for sites that do not only have a location and a direction, but also a magnitude of some sort (a speed, for example). These are discussed on a separate page.
Input format
A Vorosketch input file with sites that have an orientation starts with the number of sites, and then specifies each site by six numbers, separated by spaces:
2 x1 y1 x2 y2 w
The first number is always 2 (the number of defining points of the site). The location of the site is (x1,y1); its direction or orientation is given by the vector (x2−x1, y2−y1). The last number is the weight of the site, and can simply be set to zero for an unweighted Voronoi diagram.
Here is an example input file, which we will take as input for the examples on this page:
4
2 -0.2 -0.3  0.4 -0.3 0
2 -0.3 -0.1 -0.1  0.3 0
2  0.1  0.3  0.3 -0.1 0
2  0.1 -0.2 -1    2   0
(Implementing a more convenient input format is on the to-do list; I accept suggestions).
Secant distance
The @secant distance from a point p = (px, py) above the x-axis to a site in the origin, pointing upwards, is the secant of the angle between the positive y-axis and the ray from the origin to p. If p lies on or below the x-axis, the secant distance is infinite.
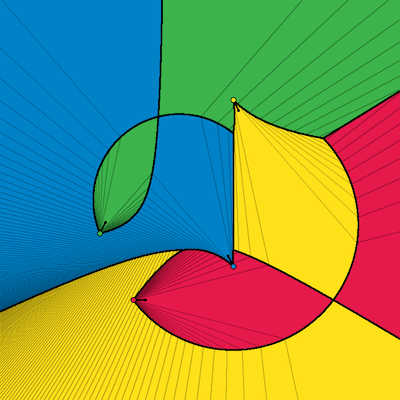
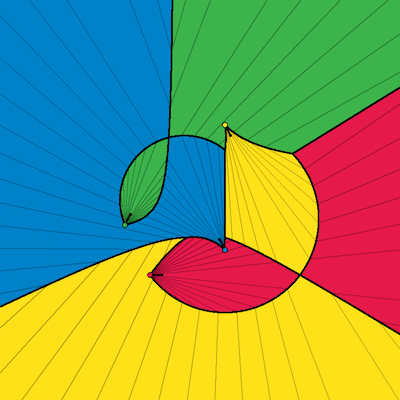
The edges of the Voronoi diagram of unweighted sites under this distance measure are points that lie on the x-axis relative to a given site, and points that have the same angle with respect to two or more sites. Thus, the Voronoi diagram consist of straight line segments, circular arcs (see Alegría et al.) and hyperbolic segments (see Haverkort and Klein).
Here is a Voronoi diagram of the sites from the example input file given above:
vorosketch -m secant -bczi 0.0333 -w 0.6 -r 800
Angle-restricted distances
The secant distance can be used to define distance measures in which the distance from a point p to a site is unbounded if p lies behind the site, or at a large angle with respect to the site's orientation, whereas the distance is measured in the usual way if p lies at a small angle with respect to the site's orientation.
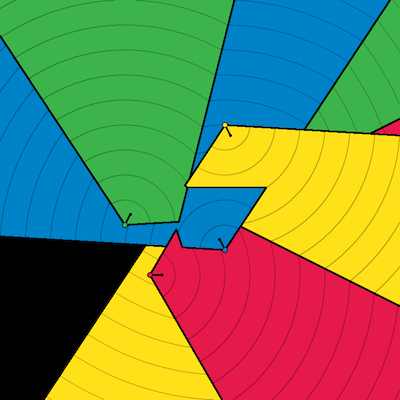
For example, here is a Voronoi diagram of the sites from the example input file given above, in which each site has bounded distance only to those points in the plane that lie within a wedge with a 120 degrees' angle:
vorosketch -m "secant<2 ? euclidean" -bczi 0.1 -w 0.8 -r 800
If the opening angle is 180 degrees or more, the angle restriction cannot be checked with the secant distance. For wedges with an opening angle of 2x, for any x, one can instead use the turn distance as in “turn<x ? euclidean”.
Semi-Voronoi diagrams
A semi-Voronoi diagrams is a Voronoi diagram for angle-restricted Euclidean distance with an opening angle is 180 degrees. This distance function can be expressed as “oriented(fy)>0 ? euclidean”.
Catch distance
The @catch distance between a point p and a site in the origin, pointing upwards, is half of their secant distance multiplied with their Euclidean distance.
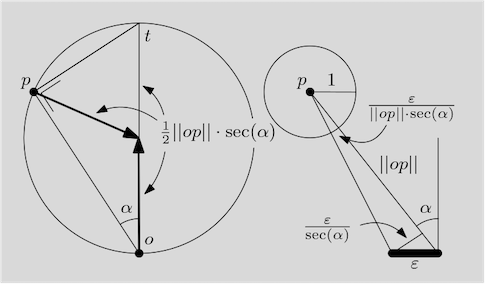 If p lies at distance ||p|| from the origin at an angle α with respect to the positive y-axis, Δopt, where t = (0, ||p||·sec(α)), is a triangle with a right angle at p. Thus, by Thales's theorem, p lies on the circle with centre (0, r), and radius r, where r = ½·||p||·sec(α)) is the catch distance from the site to p. Thus, all points at catch distance r lie on a circle that have the origin as their lowest point.
The distance models two very different “semantics”. First: how long does it take for somebody that starts at p and can move in any direction to catch up with somebody that starts in the origin and moves up on the positive y-axis if both move at speed 1? This interpretation is discussed in more detail on the page about Voronoi diagrams of moving points.
Second: if the site models a small plate (maybe a light source) of some small standard width ε, with normal oriented upwards, then angular size of the plate in the projection on a circle around p approaches ε / (||p||·sec(α)) as ε tends to zero. Thus, the catch distance models (up to a constant factor) how small the plate is, relative to its size, in the field of view from p.
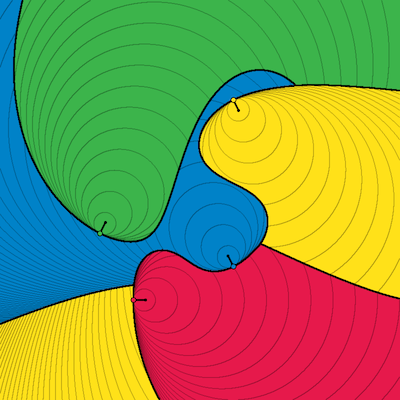
Here is a Voronoi diagram of the sites from the example input file given above:
vorosketch -m catch -bczi 0.0333 -w 0.6 -r 800
Visibility distance
As explained above, the catch distance between a point p and an oriented site models how small the site is in the field of view from p, in a two-dimensional world. In a three-dimensional world, we would not calculate the length of the site (relative to ε) in the projection on a unit circle around p, but we would calculate its area in the projection on a unit sphere around p. Thus, the distance measure, the relative “smallness” of the site, grows quadratically, rather than linearly, with the Euclidean distance.
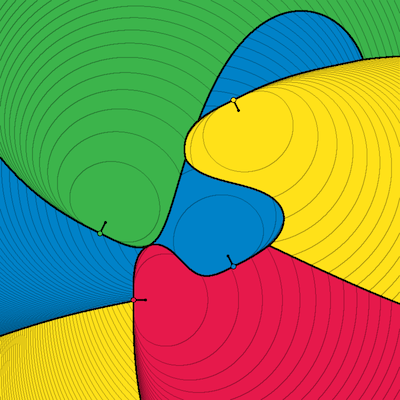
We could think of the sites as disk-shaped light sources that are placed orthogonal to the plane. A Voronoi diagram of multiple sites under this distance measure could model from which site each point in the plane receives most light. Here is a Voronoi diagram of the sites from the example input file given above:
vorosketch -m "secant*squared" -bczi 0.05 -w 0.6 -r 800
Turn distance
The @turn distance from a point p = (px, py) to a site in the origin, pointing upwards, is arccos(py/||p||) or, equivalently, atan2(|px|, py), that is, the angle between the positive y-axis and the ray from the origin to p.
The edges of the Voronoi diagram of unweighted sites under this distance measure consist of straight line segments, circular arcs (see Alegría et al.) and hyperbolic segments (see Haverkort and Klein).
Here is a Voronoi diagram of the sites from the example input file given above:
vorosketch -m turn -bczi 0.1 -w 0.8 -r 800
Left-turn distance
The @leftturn distance from a point p = (px, py) to a site in the origin, pointing upwards, is π + atan2(px,-py), that is, the angle between the positive y-axis and the ray from the origin to p, measured counterclockwise from the positive y-axis.
The edges of the Voronoi diagram of unweighted sites under this distance measure consist of straight line segments and circular arcs (see Alegría et al.).
Here is a Voronoi diagram of the sites from the example input file given above:
vorosketch -m leftturn -bczi 0.1 -w 0.8 -r 800
Oriented distances
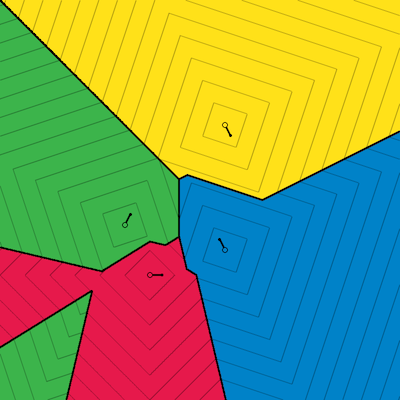
With oriented(d), one can translate and rotate the coordinate system such that the site is in the origin, pointing upwards, before the distance function d is evaluated. Thus one can create, for example, the following Voronoi diagram, in which the distance between a point and a site is defined as the L1 (Manhattan) distance in the coordinate system that is rotated according to the orientation of the site.
vorosketch -m "oriented(@L1)" -bczi 0.1 -w 0.8 -r 800
