Table of Contents
Vorosketch
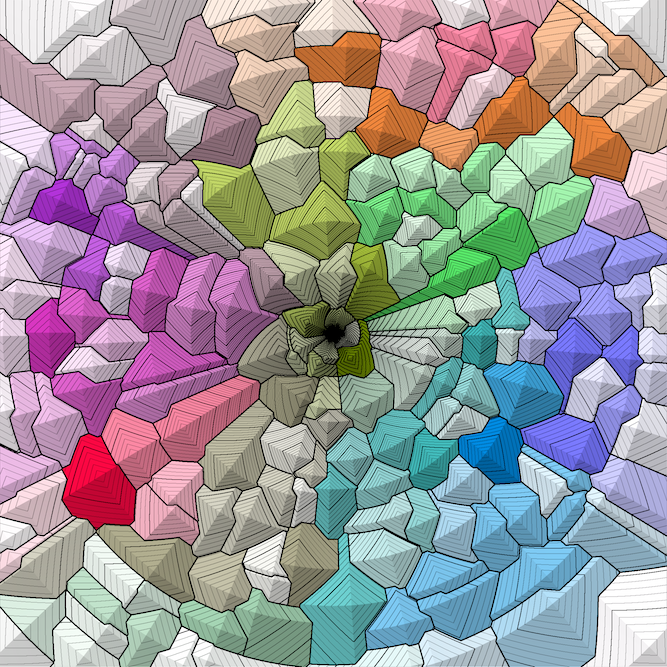
Vorosketch is a simple tool that sketches small Voronoi diagrams as a bitmap in a few seconds. Vorosketch's raison d'être is that it is easy to adapt to different distance measures, regardless of whether we understand the geometry of the bisectors yet. Thus we can use Vorosketch for explorations and illustrations; it supports several novel distance measures. Vorosketch draws:
- additively/substractively or multiplicatively/divisively weighted
- first-order, second-order, second-closest-site and farthest-site Voronoi diagrams under the
- Euclidean (L2), squared Euclidean (power diagrams), Manhattan (L1) metrics for point sites or polyline sites,
- L−∞ (minimum), L0 (coordinate product), L∞ (maximum), any other Lp distance measures, the Euclidean highway and Manhattan highway distance measures (with faster travel on specified line segments), and the triangular-grid, Karlsruhe, city, Köln, orbit-in, orbit-out, spherical, hyperbolic, and inverted-plane distance measures for point sites,
- angular-size, detour, and dilation measures for polyline sites,
- secant, catch distance, turn, left-turn, and Dubins path length measures for half-line/ray/rooted-vector sites,
- and weighted sums or products of these distance measures (including semi-Voronoi diagrams),
- with or without distance contour lines (lines of equidistant points)
- in black and white or with colour-coded sites and regions.
Use Vorosketch wisely; it is not designed for speed or for accuracy. Vorosketch may miss features of the diagram that are narrower than a pixel, and I made no attempt to analyse or control the error margins in the distance computations. For standard Euclidean Voronoi diagrams of large numbers of points in the plane, AGB-DTVD and many other implementations are orders of magnitude faster and more precise.
Below you can find Vorosketch's source code, examples of input and output, some technical background on the different types of diagrams, some answers to possibly-asked questions, and a list of what is new as compared to previous versions. There are separate pages on how to use Vorosketch for:
- Voronoi diagrams of oriented points (in which the distance measure depends on a site's direction or orientation)
- Voronoi diagrams of moving points (in which the distance measure depends on a site's direction and speed)
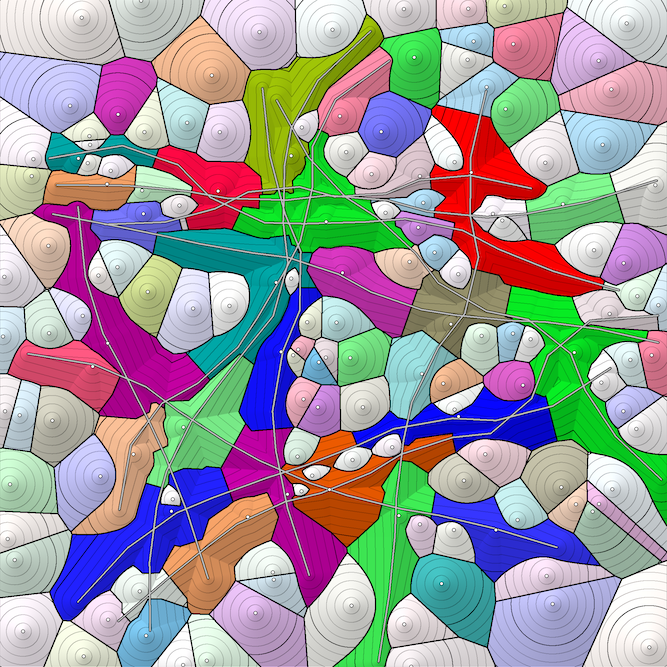
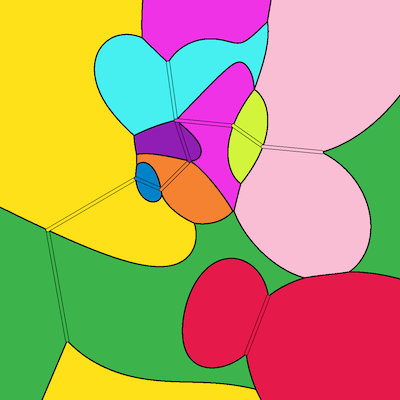
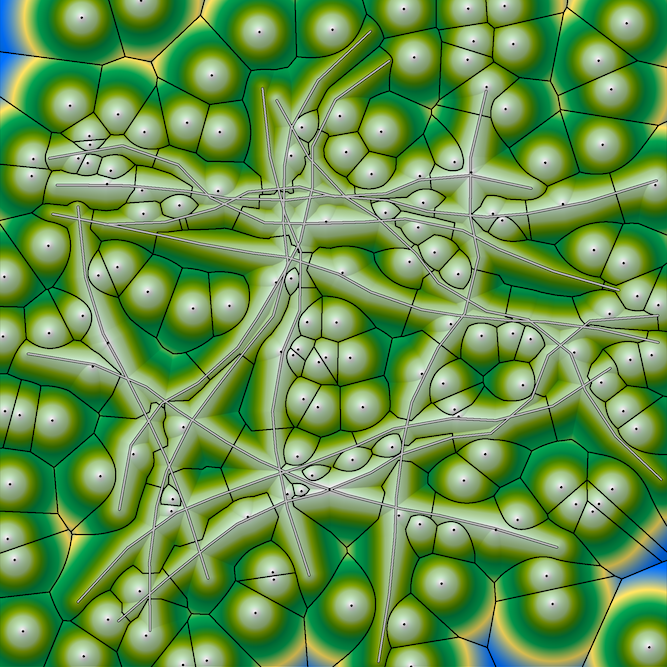
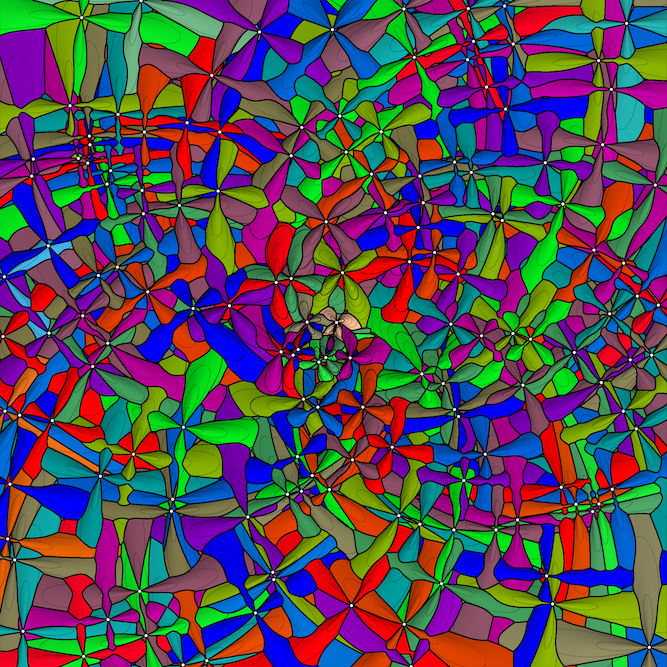
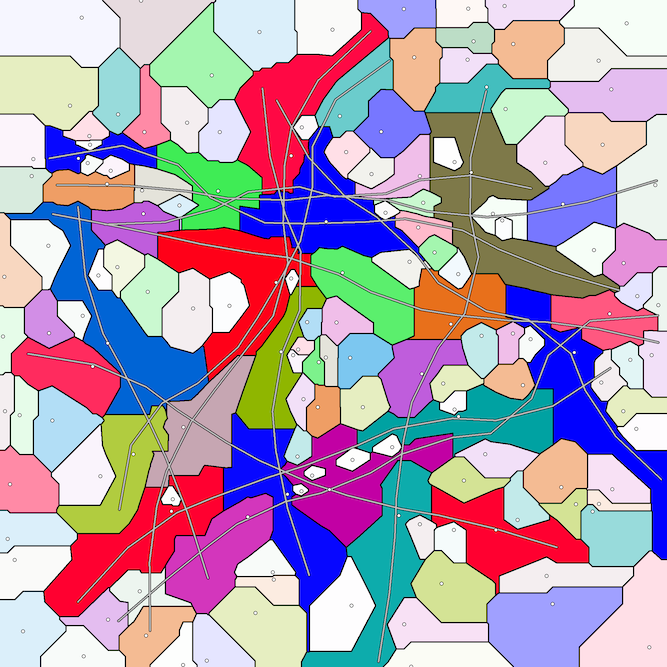
As a teaser, below is a travel-time Voronoi diagram of 150 points, where travel along highways is ten times as fast as across the plane. For more large figures, see the gallery.
Download
Vorosketch is written in C++, here is the source code. The current version is 0.37 beta of 22 March 2023. Vorosketch does not use any libraries apart from the standard template library, so it should be easy to compile with any C++ compiler. Please let me know if you have trouble compiling the code or if you find any bugs. Vorosketch is licensed under the Apache License, please see the source code for further details. To enable user-defined distances from userdistances.cpp (see the source code for an example), compile with the -D INCLUDE_USER_DISTANCES option.
Examples of input and output
Here are some examples of what Vorosketch can do. All examples were made with the “-r 1200” option to produce a drawing of 1200×1200 pixels in bmp-format. For convenience, we omit “-r 1200” from the command lines below. For publication on this webpage, the images were downsampled to 400×400 pixels and converted to png-format.
For a more complete list of options, please run Vorosketch with the -? option.
The basics
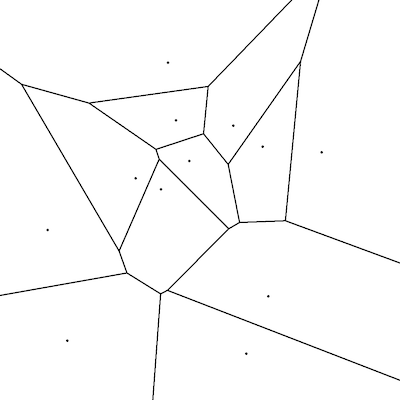
A standard Voronoi diagram of points in the Euclidean plane is produced by:
vorosketch <sites >image.bmp
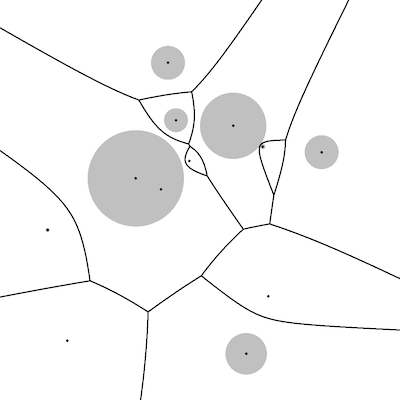
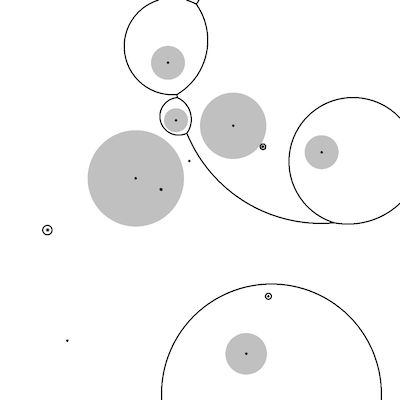
Next: the same, with additive weights. The boundaries of the shaded areas are at equal weighted distance to their sites.
vorosketch <sites >image.bmp
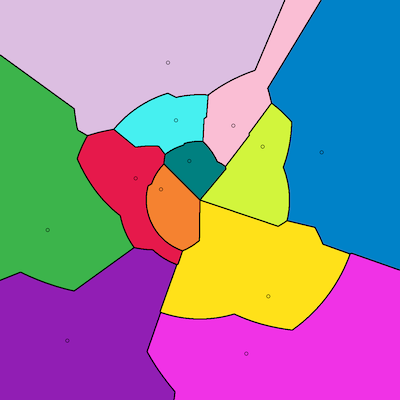
Next: a power diagram (that is, using squared distances with additive weights). And why not add some colour, too, using Sasha Trubetskoy's beautiful colour scheme:
vorosketch -m squared -c <sites >image.bmp
With the -i and -g options one can add contour lines and shading:
vorosketch -i 0.05 -c -g 0.2 <sites >image.bmp
Euclidean distance with multiplicative weights:
vorosketch -d <sites >image.bmp
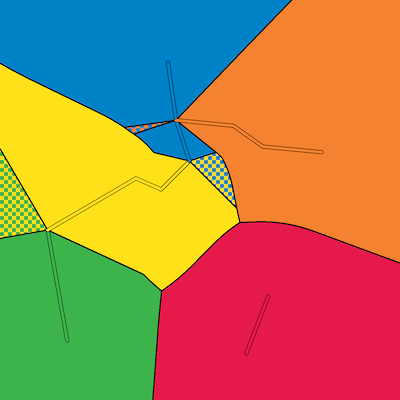
All you have seen so far, also works for polyline sites. Let us use colour (-c) and add the black region boundaries nonetheless (-b). As you can see, there are areas that are at equal distance from two sites:
vorosketch -b -c <sites >image.bmp
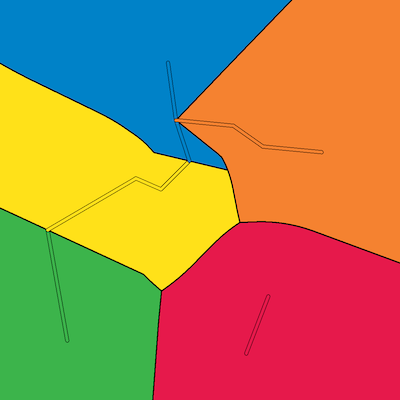
To cut the equal-distance areas in a sensible way, use the -s option to shorten the polylines slightly:
vorosketch -b -c -s 0.01 <sites >image.bmp
Points with directions (rays)
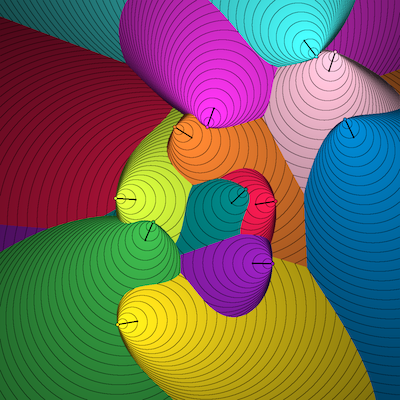
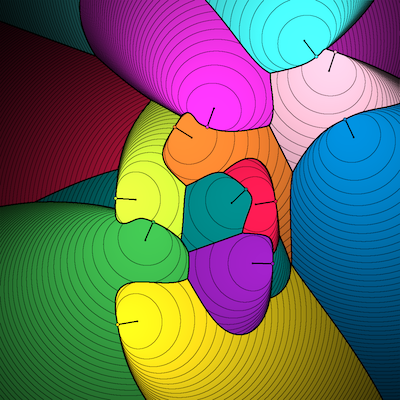
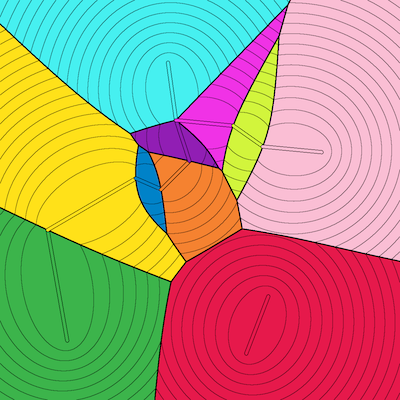
In the diagram below each site moves at constant speed in the direction indicated by the black “arm” that originates from its coloured dot. We define the distance from a point q to a site p as the distance one has to travel from q (at the same constant speed) to meet (catch) the moving site p. This leads to the following Voronoi diagram of moving points:
vorosketch -m catch -i 0.025 -c -g 1.25 <sites >image.bmp
We can also make a Voronoi diagram of points that move at different speeds, while the catcher moves at a fixed speed. For example:
Another interpretation of the same diagram is that a point q belongs to the site p that can reach q fastest, when the site's original speed and direction are subjected to an instantaneous directed acceleration of a fixed magnitude.
Now let the sites represent disks, oriented perpendicular to the drawing plane and perpendicular to the black arms drawn in the diagram. A disk at a point p emits light on the side of the black arm (whose end point we denote by p') but not on the other side. Naturally, the light received by a point q in the plane is now inversely proportional with the secant of the angle qpp' and with the squared distance to p. We want to produce a diagram that shows, for each point in the plane, from which disk it receives most light. For this purpose, we use Vorosketch's ability to multiply distance measures:
vorosketch -m squared*secant -i 0.05 -c -g 1 -b <sites >image.bmp
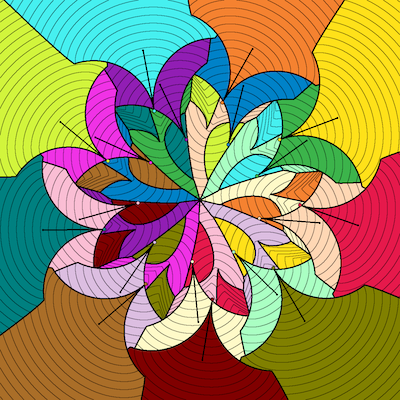
Now suppose the sites are oriented line segments, and the distance to a point p is how much we would have to rotate the segment around its starting point in order to point towards p:
vorosketch -m turn -b -c <sites >image.bmp
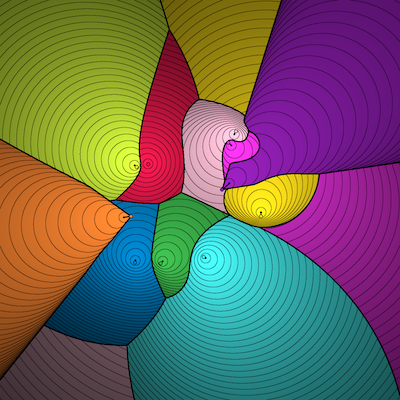
For a vehicle, rotating can be an issue too. Here is a Voronoi diagram of 18 cars, each visualised as a rooted vector. The origin of the vector (marked by a coloured dot) marks the current location of the car, and the length indicates its minimum turning radius. The distance from a car to a point is defined as the length of the shortest route that the car can take to that point while only driving forward and subject to its minimum turning radius:
vorosketch -m dubins -i 0.04 -b -c <sites >image.bmp
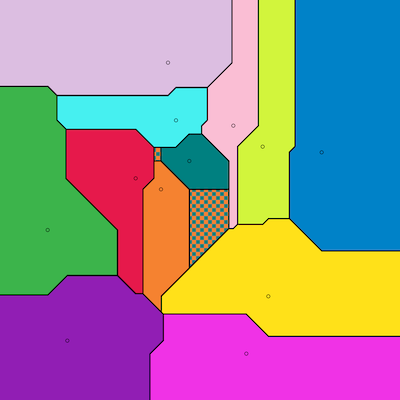
In semi-Voronoi diagrams, distances are as usual, except that the distance between a point and a rooted-vector site is infinite if the point is not in front of it, that is, if the site would have to rotate more than 90 degrees to be directed at the point. Semi-Voronoi diagrams can be produced by multiplying the usual distance measure with the special “semi” distance, for example:
vorosketch -m semi*euclidean -b -c <sites >image.bmp
Special distance measures for line segments
Some of the distance measures for point sites also work for segment or polyline sites. In addition, Vorosketch implements some distance measures that are defined specifically for segment and polyline sites. For exampe, suppose we say the closest object to p is the one that has the largest angular size as seen from p:
vorosketch -m angle -b -c <sites >image.bmp
Or the closest line segment qr to p is the one that minimises the detour if we would want to visit p on the way from q to r, that is, it minimises |qp| + |pr| - |qr|:
vorosketch -m detour -i 0.1 -b -c <sites >image.bmp
Lp distances
Under the Manhattan (L1) metric, the distance between two points is determined by the shortest path that consists only of vertical and horizontal segments. To make sure that regions that are equidistant to two sites are recognisable as such, use the -e option to catch rounding errors:
vorosketch -m manhattan -e 0.01 -b -c <sites >image.bmp
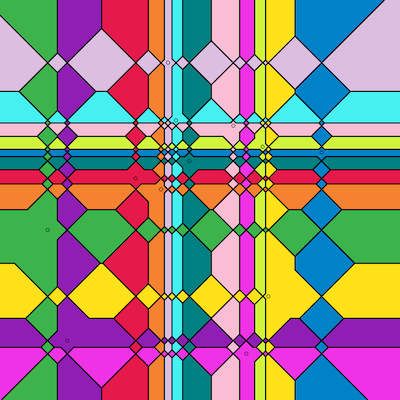
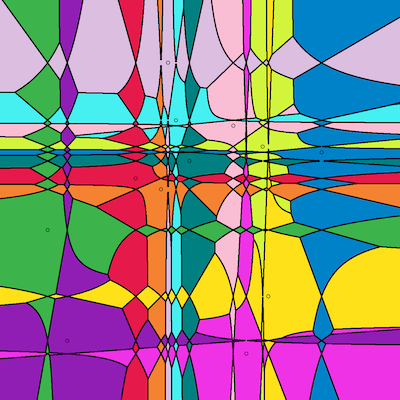
In fact, we can calculate Voronoi diagrams for any geometric Lp distance measure, even for p < 1, for example the minimum measure L−∞, the product measure L0, or L0.5:
vorosketch -m L-inf -b -c <sites >image.bmp
vorosketch -m L0 -b -c <sites >image.bmp
vorosketch -m L0.5 -b -c <sites >image.bmp
Distances in which the centre is special
Under the Karlsruhe metric, distances are determined by paths that consist only of radial segments (to/from the centre of the map) and circular arcs (with the circle centre in the centre of the map):
vorosketch -m karlsruhe -e 0.01 -b -c -+ <sites >image.bmp
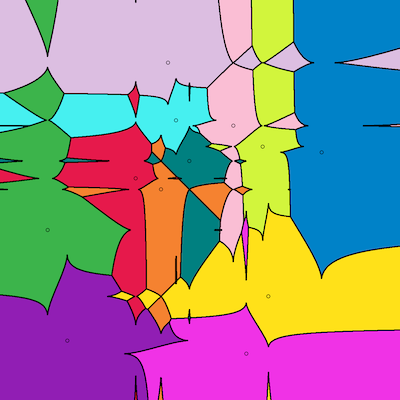
In a real city, say, Köln, you would also have to take account that travelling in the city centre is slow. Suppose we can travel only on radial segments and circular arcs, with a speed that is linearly proportional to the distance from the centre, slightly faster on the circular arcs than on the radial axes (in effect, this turns distances into L1-distances in polar coordinate space with a logarithmic radius axis, with the actual centre point becoming unreachable). We use Vorosketch's ability to add up multiple distance measures:
vorosketch -m 0.9*azimuth+logradius -b -c -e 0.01 <sites >image.bmp
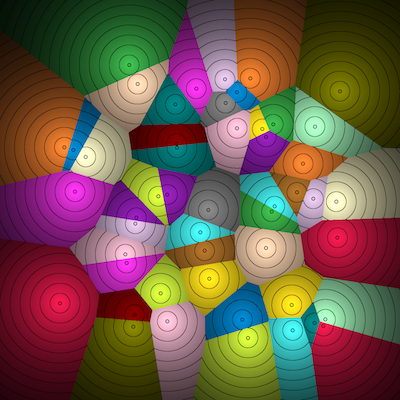
Now suppose the closest site to p is the one that would require least energy to launch a space ship that reaches p from that site, subject to gravitation towards the centre:
vorosketch -m orbitout -b -c -+ <sites >image.bmp
The closest site to p is the one that would require least energy to launch a space ship that reaches the site from p:
vorosketch -m orbitin -b -c -+ <sites >image.bmp
Travel time diagrams using highways
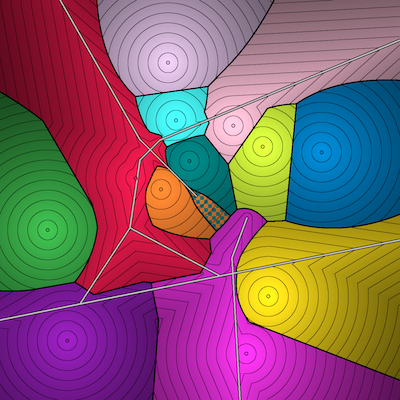
Very different yet is the diagram that results, if one can travel in all directions, but travel on highways is faster than cross-country. For this diagram, the -i option is used to show contour lines at intervals of 0.05:
vorosketch -m highway -b -c -e 0.01 -i 0.05 -g 0.5 <sites >image.bmp
Second-order Voronoi diagrams
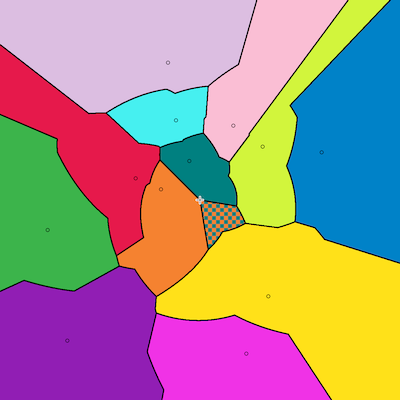
Finally, a second-order Voronoi diagram:
vorosketch -2 -b -c <sites >image.bmp
Documentation
There are separate pages on how to use Vorosketch for:
- Voronoi diagrams of oriented points (in which the distance measure depends on a site's direction or orientation)
- Voronoi diagrams of moving points (in which the distance measure depends on a site's direction and speed)
Technical background
In principle, Vorosketch simply computes, for each pixel, the distance to each site. Of course that is not a particularly efficient way to compute the diagrams, but it works for any type of diagram, and for small diagrams to be used as illustrations, it is fast enough. In fact, Vorosketch speeds up many computations by applying a filter that allows it to rule out a site as a closest site for a whole block of pixels at once.
If there are multiple closest sites, Vorosketch records two of them (if there are more than two, Vorosketches takes the first two by order in the input file). The reason that only the two closest sites are considered, is that so far, that was enough for my purposes. To handle situations in which there are more than two closest sites, we would first have to decide how we would want that to be visualised. I am open to suggestions if there is a need for it.
The pages listed above under documentation contain some more details on the computation of the distance measures discussed on those pages.
Possibly-Asked Questions
The output seems wrong. Why?
Sometimes I find bugs and fix them, or I adapt the user interface to catch problematic combinations of parameter settings. If you discover a bug, please check if you are using the newest version of Vorosketch. If you compiled with the -ffast-math option, then try without: Vorosketch relies on correct handling of ∞, −∞ and not-a-number. If the bug is still there, please let me know.
Why does shading by distance gradient (the -z option) does not work?
It should work. However, the distances are not scaled automatically. Depending on the input, some distance measures tend to produce rather small values for points in the [−1,1]x[−1,1] square, so that the distance gradients are small and the distance landscape appears flat. In particular, the squared Euclidean, secant, and catch distances may have this problem (whereas the turn and leftturn distances tend to have too much variation, producing steep gradients). To remedy this, scale the distances. For example, use “-m squared*5” instead of “-m squared”.
Could diagram X not be computed faster?
Certainly. The computation of the catch and push Voronoi diagrams (with sites moving at different speeds), Dubins Voronoi Diagrams and hyperbolic Voronoi diagrams is particularly slow, because good bounds for the pre-scan heuristic have not been implemented (you can check this by running with -v and see what it says about “Distance computations eliminated by filter”). Since I have to budget the time I spent programming, I try to be selective in what computations I choose to optimise. If you are going to produce thousands of Voronoi diagrams of some particular distance measure that need to be rendered faster, please let me know and I might be tempted to speed up my efforts to speed it up. Until then, you may want to know about the following options:
- Try, for example, -r 1000 to generate a diagram with only 1 million pixels instead of the usual 4 million (effective especially if a good filter is missing).
- Use the -o option and avoid -g, -i, -t, -u, and -z (effective especially if a good filter is present): this eliminates the need for correct distances to be computed for every single pixel.
Why do I get an error: “Distance function is not compatible with or has not been implemented for any type of site”?
This happens if one combines distances whose domains (types of sites for which they are defined and implemented) are incompatible. For example, using “-m karlsruhe+dilation” results in this error, as the Karlsruhe distance has only been implemented for point sites, whereas the dilation distance is only defined for segment and polyline sites.
Why do I get an error: “missing distance name”?
This happens if, in the argument of the -m option, a distance name or formula is missing where one is expected. For example, using “-m euclidean+” results in this error, because the second operand of the + operator is missing.
Why do I get an error: “negative weight detected in input”?
If you use divisive (multiplicative) weighting (the -d option), weights are not allowed to be negative. The reason is that lower bounds on distances would become upper bounds and vice versa: the implementation would need to handle this and currently it does not. Please let me know if you had a use for negative divisive (multiplicative) weights.
Why do I get an error: “negative value -1.0842e-19 for upper bound on first operand to power operator detected” (or a similar message)?
The power operator does not accept negative values for the first operand (for taking squares, use the sq function instead). If you suspect that the negative value is the result of a rounding error, use the maximum operator | to round negative values up to 0, for example: -m “(ln(karlsruhe/euclidean)|0)^1.5”
Why do I get an error: “too many sites”?
Vorosketch is designed for relatively small inputs, it is not designed to scale well. The code sets a somewhat arbitrary maximum of 20,000 sites (less when using highway distance). Not very far above that, Vorosketch would crash because it uses a quadratic amount of memory (which is entirely avoidable, but would require some programming effort). With some inputs, distance measures and options, Vorosketch would be impossibly slow with far fewer sites already, due to the arithmetic operations involved.
Why is the output in this inefficient bmp-format?
Because I had C++ code for that lying around already and I did not get round to studying PNG yet. This is somewhere on my to-do list, but all the way at the bottom, to be honest.
Mr. Haverkort, could you please add feature X?
Just ask me and I will have a look.
What is new?
- Coming up in version 0.38: C-style comments allowed in the colour palette files; -/ option to generates sites to test colours
- Since version 0.36, Vorosketch can use the hyperbolic cosine of the distance between points in hyperbolic space as a distance measure (which is substantially faster to compute than the actual distance).
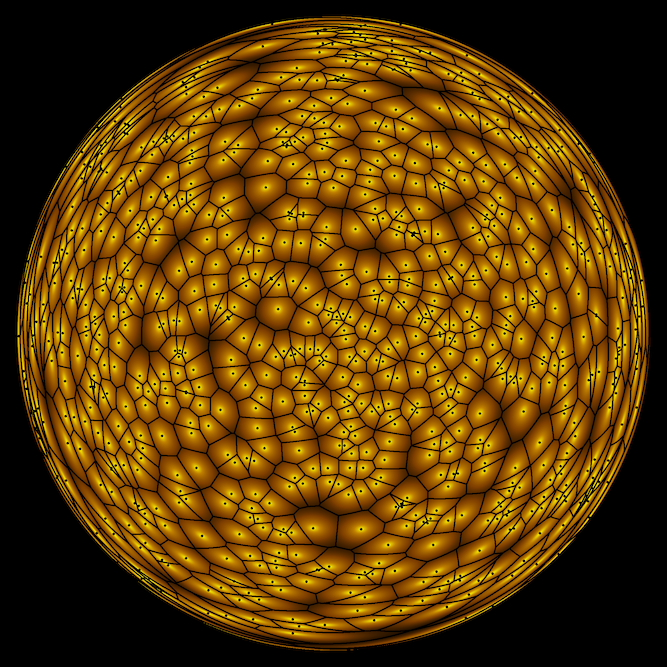
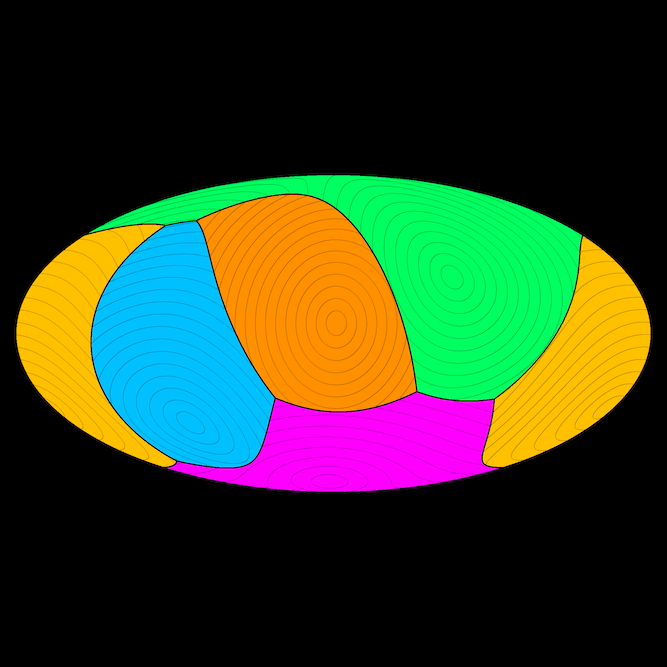
- Since version 0.34, many more projections for Voronoi diagrams of points on the sphere are supported. For details, see: spherical Voronoi diagrams with Vorosketch.
- Since version 0.32, the Poincare halfplane model is supported (in addition to the six previously implemented models of the hyperbolic plane).
- Since version 0.32, Vorosketch supports distances to point sites under inversion in the unit circle.
- Since version 0.31, the “push” distance for vector sites is supported (without pre-scan): the distance from a vector site to a point in the plane is the time it takes to get from the site to the point, given the initial speed and direction (as specified by the site vector) and constant (directed) acceleration.
- Since version 0.31, Vorosketch supports distances in hyperbolic space rendered according to various models (projections) (without pre-scan).
- Since version 0.31, approximations for the the detour, dilation and angular-size measures are used to speed up the pre-scan.
- Since version 0.31, the angular-size distance has been redefined: what used to be x in [1/(2π),∞) is now 2πx−1 in [0,∞).
- Since version 0.31, new distance measures for point and vector sites can be defined by only implementing the distance measure for a canonical site in the origin, oriented upwards.
- Since version 0.31, it is possible to define sites that consist of multiple points.
- Since version 0.24, Vorosketch supports distances on the sphere rendered according to an equal-area azimuthal, cylindrical, or elliptical projection.
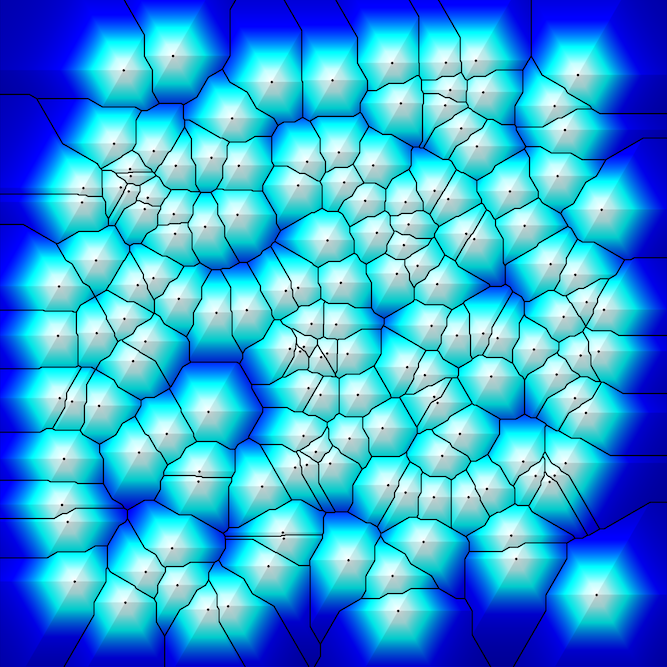
- Since version 0.24, distance in a triangular grid is supported.
- Since version 0.24, colour schemes can be read from a file.
- Since version 0.24, distances can be shown by a customisable colour gradient (heat map).
- Since version 0.23, the Manhattan highway distance is supported, in which non-highway travel is measured by the L1 metric.
- Since version 0.22, for most distance measures Vorosketch makes a pre-scan of a grid of squares, in which it obtains bounds on the distances to the sites from each square. These bounds are then used to determine for which pixels and sites it makes sense to compute the distance exactly, and for which it does not. Depending on the distance measure and the input, this may speed up Vorosketch by an order of magnitude or more.
- Since version 0.22, distance functions can be composed on the command line from built-in distance functions and a number of standard mathematical operators. This should also work with the highway distance now.
- Since version 0.22, there are many new colour options, including a choice of palettes, heuristics (experimental: subject to change) to assign colours as to maximise or minimise contrast between adjacent regions, shading based on the gradient of the distance function, and saturation based on the number of neighbours of a region.
- Since version 0.22, Vorosketch can generate random sites (experimental: subject to change).
- Since version 0.22, the unit speed v for the catch distance with mixed-speed sites is no longer selected by “-m mixedcatch -i v”, but by “-m catch@v”.
