Table of Contents
Voronoi diagrams with highways in Vorosketch
Vorosketch supports Voronoi diagrams of points in the plane, where the distance between two points in the plane is defined as the minimum travel time from one point to the other under the following conditions:
- one can travel on designated polylinear highways with speed more than 1;
- one can travel “cross-country”, that is, anywhere in the plane, with speed 1.
Two variants are currently implemented:
| Euclidean highway | cross-country travel distances are measured by the Euclidean distance (L2 metric) |
| Manhattan highway | cross-country travel distances are measured by the Manhattan distance (L1 metric) |
Note that in both variants, travel time along a highway is measured by the Euclidean distance covered, divided by the highway's speed.
Input format
The input for a Voronoi diagram with highways first gives the sites, as explained here. Next, the input file gives the number of highways, followed by each highway's specifications. A highway's specification starts with the number of vertices; then, for each vertex, its x- and its y-coordinate; it ends with the travel speed along that highway—which must be more than one. Here is an example with eleven unweighted sites and three highways with different speeds:
11
  1  0.08  0.67 0
  1 -0.20  0.04 0
  1 -0.16  0.20 0
  1  0.69  0.68 0
  1  0.66  0    0
  1 -0.64 -0.67 0
  1 -0.25 -0.48 0
  1 -0.2   0.8  0
  1  0.69 -0.61 0
  1  0.15 -0.65 0
  1  0.6  -0.4  0
3
 12  0    -0.7  -0.4  -0.4   -0.64 -0.08  -0.64  0.08
    -0.4   0.4  -0.08  0.64   0.08  0.64   0.4   0.4
     0.85 -0.15  0.75 -0.55   0.35  -0.7    0    -0.7
    4
  4 -0.42 -1.5   0.07 -0.25   0.35  0.1    1.6   0.94
    8
  2 -1.5   0.45 -0.06  0.09
    6
Example
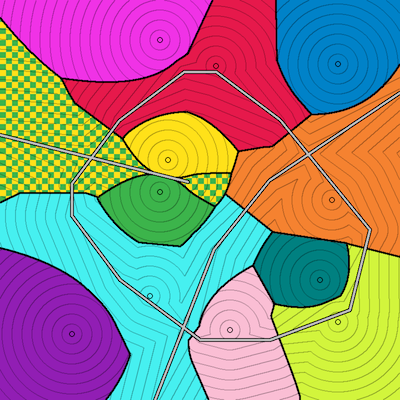
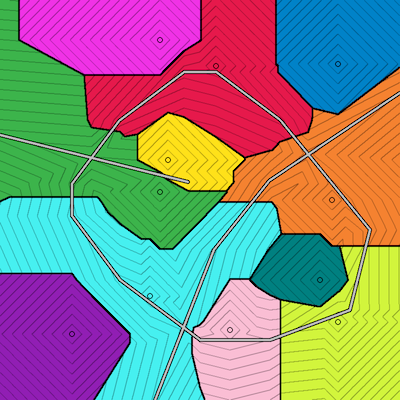
Below are two examples, using the input file above. The options -bci 0.1 -r 800 specify the use of black bisectors, coloured regions, distance contour lines at 0.1 intervals, and an image size of 800×800 pixels. Further options to control the style and colours of Vorosketch's output are discussed on a separate page. Note the use of -e 0.01 to make sure that regions that are at equal distance from two sites are rendered properly.
vorosketch -m "euclidean highway" -e 0.01 -bci 0.05 -r 800
vorosketch -m "manhattan highway" -e 0.01 -bci 0.05 -r 800
Technical background
With unweighted point sites in the highway distance, finding the shortest path between points becomes part of the challenge. Each segment of such a shortest path has two endpoints. Some of these endpoints are inherent to the input configuration (point sites, endpoints of highway segments, and intersection points of highway segments), the others (where one enters or leaves a highway at an arbitrary point) we may call free. Two observations help us limit the complexity of finding shortest paths.
First, when we enter or leave a highway with speed s>1 at a free point, we always enter or leave it under an angle with cosine equal to 1 divided by s. (Here, the speed of travelling cross-country is taken to be 1.) One can easily verify that this angle is optimal: if we would enter the highway at a bigger angle, we would be making too much of a detour; if we would enter the highway at a smaller angle, we would not be taking advantage of the highway enough.
Second, to find shortest paths, we do not need to consider cross-country segments with two free endpoints. To see this, consider any cross-country segment e with two free endpoints d and f, that is, a segment that shortcuts from one highway segment C to another highway segment G. Let c=bd on C be the previous segment of the shortest path, and let g=fh be the next segment of the shortest path. Now suppose we move e to the left or to the right while maintaining its slope and maintaining the connection to C (by moving d on C) and to G (by moving f on G), so that we maintain the angles on which we leave C and enter G as per the first observation. Then the total path length changes linearly. Thus, in at least one direction, the total path length will not increase and we can move e until one of its endpoints, say d (the case of f is symmetric), hits either (i) a site, a highway endpoint or an intersection point p, or (ii) the free endpoint b that started c. In case (i), the other endpoint of e, that is, f on G, must be the free endpoint where a ray from p hits G at the correct angle. Given p and G, there are at most two such points, so we can actually precompute all such candidate free endpoints. In case (ii), c is now eliminated, and the previous segment of the shortest path, which is also a cross-country segment, must be collinear with e. Thus, we can treat the previous segment and e together as a single shortest path segment and continue our adaptations of the shortest path with two segments less than before. In the end, we can transform any shortest path into a shortest path in which each cross-country segment has at least one non-free endpoint, and all free endpoints come from a finite set that can be computed easily.
These observations allow us to precompute much of the shortest paths that we need to generate the diagram (see Gewali et al. or El Shawi et al. for further details). After that, all that is left to do is figuring out, for each pixel, what is the first input point or highway segment on that path. To do this efficiently, Vorosketch uses a heuristic solution: it first computes the eligible input points and highway segments for each cell in grid of blocks of 20 x 20 pixels (using conservative bounds on the distances that can be computed fast); then, for each pixel in the block, only shortest paths that go through these input points or highway segments need to be considered.
Contours of a point site are circular arcs and straight line segments advancing at unit speed, where the straight line segments originate from highway sections at an angle with sine equal to 1 divided by the highway speed. However, the circular arcs in a contour may have different radius, as they may grow from given points (for example, highway endpoints) that are at different distances to the starting point (site). Thus, bisectors can be straight line segments (as in unweighted Voronoi diagrams), hyperbolic arcs (as in additively weighted Voronoi diagrams) or parabolic arcs (as in line segment Voronoi diagrams).
For more on highway Voronoi diagrams, one may consult Bae and Chwa.

