Table of Contents
Fundamental types of Voronoi diagrams with Vorosketch
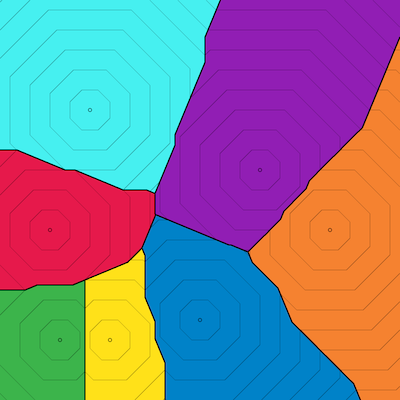
Vorosketch supports the rendering of various types of Voronoi diagrams.
Input format
The sites whose Voronoi diagram is to be generated are given on the standard input. A Vorosketch input file with simple point sites starts with the number of sites, and then specifies each site by four numbers, separated by spaces:
1 x y w
The first number specifies the number of points that defines the site, which is 1 for simple point sites. The next two numbers specify the location of the site in Cartesian coordinates. The last number is the weight of the site, and can simply be set to zero for an unweighted Voronoi diagram.
Here is an example input file, which we will take as input for the examples on this page:
7
1 -0.75 -0.15 0
1 -0.70 -0.70 0
1 -0.45 -0.70 0
1  0    -0.60 0
1  0.65 -0.15 0
1  0.30  0.15 0
1 -0.55  0.45 0
Types of Voronoi diagrams
By default, a first-order subtractively weighted Voronoi diagram is constructed based on the Euclidean distance between points and sites in the plane. The result is an image in bmp-format that is produced on the standard output. Additively weighted diagrams can be constructed by negating each site's weight in the input. For an unweighted Voronoi diagram, one should set the weights in the input file to zero. Other types of Voronoi diagrams can be selected with the following command line options.
| option | effect |
|---|---|
| -m zzz | measure: use distance measure zzz. See below for details. |
| -d | divisively weighted: create a divisively weighted Voronoi diagram: divide the distance between a point and a site by the site's weight, instead of subtracting the weight from the distance. Multiplicatively weighted diagrams can be constructed by replacing each site's weight by its inverse in the input. |
| -e x | equality: set distance equality threshold to x times the width of a pixel (default: 0); a point is considered to be equidistant to two sites if the distance to one site differs by at most x pixel widths from the distance to the other site. This option is needed for diagrams based on distance measures such as L1, which may feature larger areas that are equidistant to two sites and which might not be recognised as such due to rounding errors if the -e option is not used. |
| -2 | second-order: render the second-order Voronoi diagram, that is, the subdivision into regions such that within a region, each point has the same pair of sites as its closest pair of sites. Warning: Vorosketch has no mechanism to break ties between the second- and third-closest site in a predictable manner. The -e option cannot be used with second-order Voronoi diagrams. |
| -n | next-closest: render the next-closest-site diagram, that is, the subdivision into regions such that within a region, each point has the same site as its second-closest site. Warning: Vorosketch has no mechanism to break ties between the first-, second- and third-closest site in a predictable manner. The -e option cannot be used with next-closest-site diagrams. |
| -f | farthest: render farthest-site Voronoi diagram |
| -@ n | roll a die: use n random unweighted sites instead of reading sites from standard input. This is meant to facilitate quick testing, without any guarantees for consistent behaviour across successive versions of Vorosketch. For most distance measures, the generated sites will be points uniformly distributed in the square [−1,1]×[−1,1]. For distance measures that support other types of sites, appropriate sites might be generated according to an appropriate distribution. When using the Manhattan (L1) or Euclidean (L2) metric, denoting them by Manhattan or Euclidean may cause the -@ option to generate segment sites, whereas denoting the distance measure by L1 or L2 results in single-point sites. |
Also useful:
| option | effect |
|---|---|
| -v | verbose mode: gives a report on the options selected and shows progress bars on the computations |
Distance measures
With the -m option, the distance measure that defines the distance between a site s and any point q in the plane can be selected. The following distance measures are available:
| Lp | the Lp distance defined by (dxp + dyp)1 / p, where dx and dy are the absolute difference in x- and y-coordinate between s and q. The parameter p can be any real number. There are several special/limit cases: | ||
| name | alias | properties | |
|---|---|---|---|
| L-inf | min | the distance is min(dx, dy) | |
| Lp with p < 0 | the distance is 0 when dx = 0 or dy = 0, otherwise it is simply (dxp + dyp)1 / p | ||
| L0 | bbox | the distance is dx · dy (as proposed and analysed here) | |
| L1 | Manhattan | the distance is dx + dy | |
| L2 | Euclidean | the distance is the Euclidean distance | |
| Linf | max | the distance is max(dx, dy) | |
| squared | the square of the Euclidean distance (this produces a power diagram) | ||
| triangular | the L1 distance between s and q if both are represented by three coordinates corresponding to their orthogonal projections on three axes through the origin at 60 degrees' angles. The unit circle under this distance measure is a regular hexagon with side length 1. | ||
| karlsruhe | distance between s and q if travelling only on lines through the origin and on circle centred on the origin, as discussed by Klein | ||
| koeln | like karlsruhe, if any distance travelled is divided by the current distance to the centre (as if modelling congestion in the centre). This is equivalent to the L1 distance in a polar coordinate system with an azimuth scale that wraps around from 0 to 2π and a logarithmic radius scale. The centre itself lies at −∞ on this scale, and is unreachable. If the sites are not weighted, the resulting bisectors consist of straight line segments in the logarithmic polar coordinate system; these are Thus, in the original coordinate system (that is, what you see), the bisectors consist of segments of straight lines through the origin and of circles and logarithmic spirals around the origin. | ||
| city | like koeln, but without the restriction to travel on lines through and circles around the origin. This is equivalent to the L2 distance in the polar coordinate system with logarithmic radius scale. | ||
For distance measures for diagrams with highways, for sites on the sphere, for sites in the hyperbolic plane, for sites that have an orientation, for sites with orientation and speed/magnitude, and for sites that are larger than a point, please consult the dedicated linked pages.
New distance measures can be composed from existing distance measures by arithmetic operations. For example:
| -m “Linf + 0.707107*L1” | sum of the L∞ distance and 0.707107 times the L1 distance | output |
| -m “Linf & 0.707107*L1” | minimum of the L∞ distance and 0.707107 times the L1 distance | output |
| -m “Linf | 0.707107*L1” | maximum of the L∞ distance and 0.707107 times the L1 distance | output |
| -m “Linf < 0.707107*L1 ? L2” | L2-distance if the L∞ distance is less than 0.707107 times the L1 distance; infinite otherwise | output |
Besides the usual (multiplication, division, addition, subtraction, parentheses) and the minimum, maximum, comparison and conditional operators used above, the following operators and functions are supported:
| x~y | absolute value of x−y |
| x^y | xy |
| ln(x) | natural logarithm of x |
| sq(x) | x² |
| sqrt(x) | √x |
| abs(x) | absolute value of x |
| sx | x-coordinate of the site |
| sy | y-coordinate of the site |
| sr | Euclidean distance from the origin to the site |
| fx | x-coordinate of the point whose distance to the site is to be determined |
| fy | y-coordinate of the point whose distance to the site is to be determined |
| fr | Euclidean distance from the origin to the point whose distance to the site is to be determined |
| dt | angle soq in radians, where s is the site, o is the origin, and q is the point whose distance to the site is to be determined |
| @Lp | like Lp, but measuring the distance to the origin, independent of the site |
| @triangular | like triangular, but measuring the distance to the origin, independent of the site |
| translated(d) | apply distance measure d after translating the coordinate system such that the site lies in the origin (that is, after subtracting s from q). The measure d should not depend on the site. Admissible measures are, for example, fx, fy, fr, @Lp and @triangular |
Note: currently only negation of constants is supported. So -L2 will not work, but 0-L2 and -1*L2 are fine.
Warning: new distance formulas can give unexpected results if the sites are larger than single points: for example, segments, polylines, or finite sets of points. See the page on diagrams of sites larger than a point for an explanation.
Examples
Below are the Voronoi diagrams generated with the four combined distance functions listed above. The options -bci 0.1 -r 1200 specify the use of black bisectors, coloured regions, distance contour lines at 0.1 intervals, and an image size of 1200×1200 pixels. Further options to control the style and colours of Vorosketch's output are discussed on a separate page.
A sum of distances:
A minimum of distances:
A maximum of distances:
A conditional distance:
vorosketch -m "Linf < 0.707107*L1 ? L2" -e 0.01 -bci 0.1 -r 1200
Possibly more useful applications of conditional distances can be found on the page on Voronoi diagrams of points with an orientation.


