Table of Contents
Voronoi diagrams with gravity in Vorosketch
Orbit out
We can use Vorosketch to draw a Voronoi diagram for the following distance measure: the distance between a site s and a point q is the amount of energy needed to launch a spaceship from s into an orbit that reaches q, subject to gravitation towards the origin of the coordinate system.
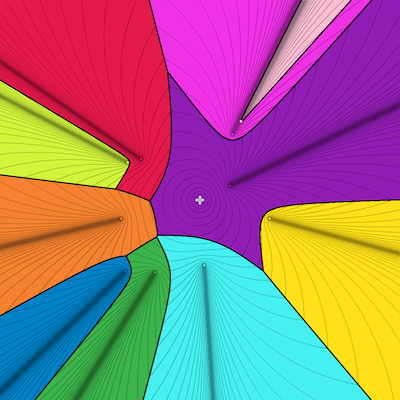
In this thought experiment, we assume that the spaceship has a fixed, constant weight and that q is stationary. The speed of a small object at position X in an elliptic orbit around a large object in the origin O is proportional to √(1/||OX|| − 1/(2a)), where a is the length of the semi-major axis of the ellipse, and therefore the kinetic energy is proportional to 1/||OX|| − 1/(2a). If we want to launch a space ship from X such that it will reach Y, we have to give it a direction and a kinetic energy that puts it into an orbit that reaches Y. Since this energy increases with a, we are looking for the orbit that includes X and Y, has O as one of its focal points, and has the smallest possible semi-major axis (non-elliptical, that is, open-ended orbits do not need to be considered: they would require more energy in any case). Note that, in an ellipse, a is exactly 1/4 of the length of the path OXFYO, where F is the second focal point. Therefore, to minimise a, we minimise the length of OXFYO, which we achieve by putting F on the line segment XY. Thus, the required energy is proportional to 1/||OX|| − 2/(||OX||+||XY||+||YO||). Thus (see fundamentals of Vorosketch), we can get a Voronoi diagram for ten random sites under the distance measure defined above, with a cross marking the origin, black bisectors, coloured sites and regions, contour lines at 0.05 intervals, 1200 × 1200 pixels, and zoomed out to cover the square [−2.5, 2.5] × [−2.5, 2.5], with:
vorosketch -m "1/sr - 2/(sr+L2+fr)" -+ -bci 0.025 -r 1200 -w 2.5 -@ 10
Note that for each site, the first term (1/||OX||, that is, 1/sr) is fixed, and a contour line (locus of points at equal distance to this site) consists of points Y with constant ||XY||+||YO||: that is an ellipse with focal points X and O, as we can see in the Voronoi diagram above.
Orbit in
Now suppose we define the distance measure the other way around: the distance between a site s and a point q is the amount of energy needed to launch a spaceship from p into an orbit that reaches s. Now our distance measure would be encoded by 1/fr - 2/(fr+L2+sr), but it turns out that, to get reasonably spaced contour lines, we better take the logarithm and use the -o option to suppress shading of regions with negative values:
vorosketch -m "ln(1/fr - 2/(fr+L2+sr))" -+ -bcoi 0.5 -r 1200 -w 2.5 -@ 10
As the diagram confirms, sending a spaceship from a point q to a site s that is right between q and Earth is easy: we just let the spaceship drop at zero cost. The distance contour lines look more complicated now. However, as Lukas Plätz pointed out to me, the bisectors are relatively simple: a point X is equidistant to two sites Y1 and Y2 if and only if 1/||OX|| − 2/(||OX||+||XY1||+||Y1O||) = 1/||OX|| − 2/(||OX||+||XY2||+||Y2O||), which is equivalent to ||XY1||+||Y1O|| = ||XY2||+||Y2O||. Thus, the bisector under our orbit-to-site distance is the same as the bisector under the Euclidean distance if each site Y has an additive weight YO; it is well-known that these bisectors are hyperbolic curves.
Do these orbiting distance measures satisfy the triangle inequality?

